With Cayman Chemical's extensive experience in lipid synthesis, purification and characterisation, you know your lipidomics study is in expert hands. Cayman's targeted and untargeted lipidomics services are conducted in their lipid analysis laboratories, equipped with state-of-the-art chromatography, mass spectrometry and data analysis systems.
What you can expect from Cayman's lipidomics services:
- Expert consultation on best practices, including sample collection, processing and storage to preserve sample integrity
- Optimised sample extraction protocols guided by accepted literature methods
- Rigorously validated MaxSpec mass spectrometry standards that control for variability and enable accurate quantitation
- Profile analysis or absolute quantitation of customisable analyte sets
- Timely updates, interactive real-time data review and comprehensive reporting with strict confidentiality
- Results you can trust
To discuss your project, please contact us.
Untargeted lipidomics profiling service
Cayman Chemical provide a discovery lipidomics service, utilising untargeted approaches to analyse hundreds to thousands of lipid species from biological samples, to create a detailed lipid profile.
Conducted in state-of-the-art lipid analysis laboratories, Cayman's untargeted lipidomics profiling enables the identification of profile changes across all major lipid classes, or within a single lipid class, including fatty acyls, glycerolipids, glycerophospholipids, sphingolipids and sterol lipids.
Untargeted lipidomics service process
- Lipids are extracted from samples using liquid-liquid methods
- Lipids are chromatographically separated, using HPLC or UPLC to detect individual molecular species & identify changes between samples
- High-resolution mass spectrometry (HRMS) & tandem mass spectrometry (MS/MS) are used to detect & identify lipid species
Data processing
Data-processing software and publicly available databases facilitate the identification and relative quantitation of candidate lipid species. When molecular identification is provided based on the LC-MS/MS data available, Cayman adheres to the recommendations issued by the Lipid Maps® consortium and the Lipidomics Standards Initiative.
Data reporting
Data is reported as tables of mass-to-charge ratios (m/z), with ion intensity peak areas normalised to internal standards, which can also be visualised using powerful plotting and graphing tools. Statistical analysis can also be applied to identify significant changes within complex lipid profiles.
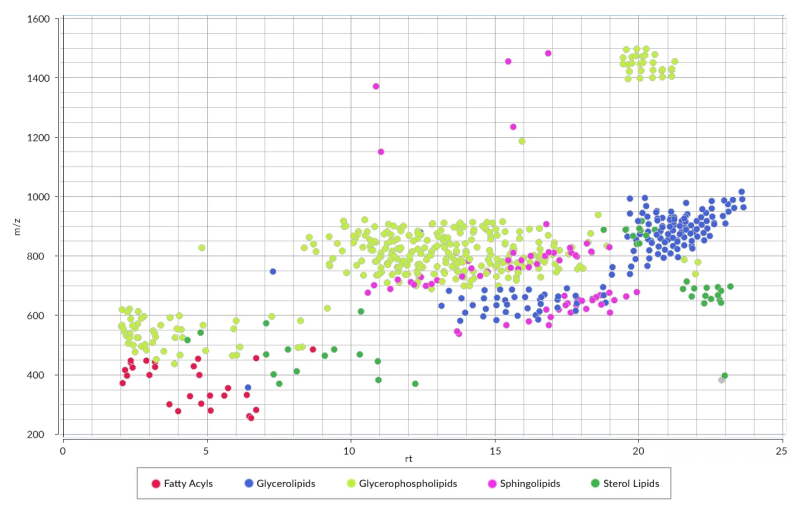
2D feature plot (m/z vs retention time) generated using Lipostar lipidomics software package representing identified molecular species, corresponding to different lipid classes, in human plasma.
To find out more or discuss your project with us, please contact us.
Targeted lipidomics & absolute quantitation service
Cayman Chemical's targeted lipidomics service enables the focused analysis of a known collection of lipids. This service maximises the data obtained from precious samples, using precise method development to include equal amounts of isotope-labeled or odd-chain internal standards selected from customisable lipid panels.
This service is particularly useful for quantifying lipids present at low levels in samples, such as endogenous bioactive lipids, such as prostaglandins, leukotrienes or endocannabinoids.
Targeted lipidomics service process
Lipids from each sample are extracted using standardised protocols
Lipids are analysed by LC-MS/MS using analyte-specific collision-induced mass transitions from the molecular ion (or, in some cases, from a known adduct) to a characteristic fragment ion
Analyte concentrations are determined from calibration curves prepared from authentic standards, or surrogate standards when necessary
Data reporting
Standard statistical analysis tools can reveal changing trends in lipid species among experimental groups, which can be visualised with a heat map or other available graphical tools.
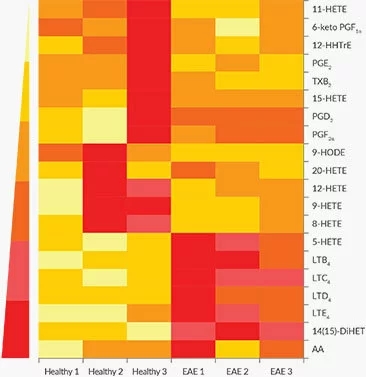
Heat map generated from relative quantitation by LC-MS/MS of oxylipins in the spleens of mice. Visualisation tools like this one help find changing trends within complex sets of data.
To find out more or discuss your project with us, please contact us.